Settings
The Settings screen (route /settings) holds a read-only watchdog summary,
the entry point back into the cloud setup wizard, the deployment-settings
editor, and the app's own diagnostic log.
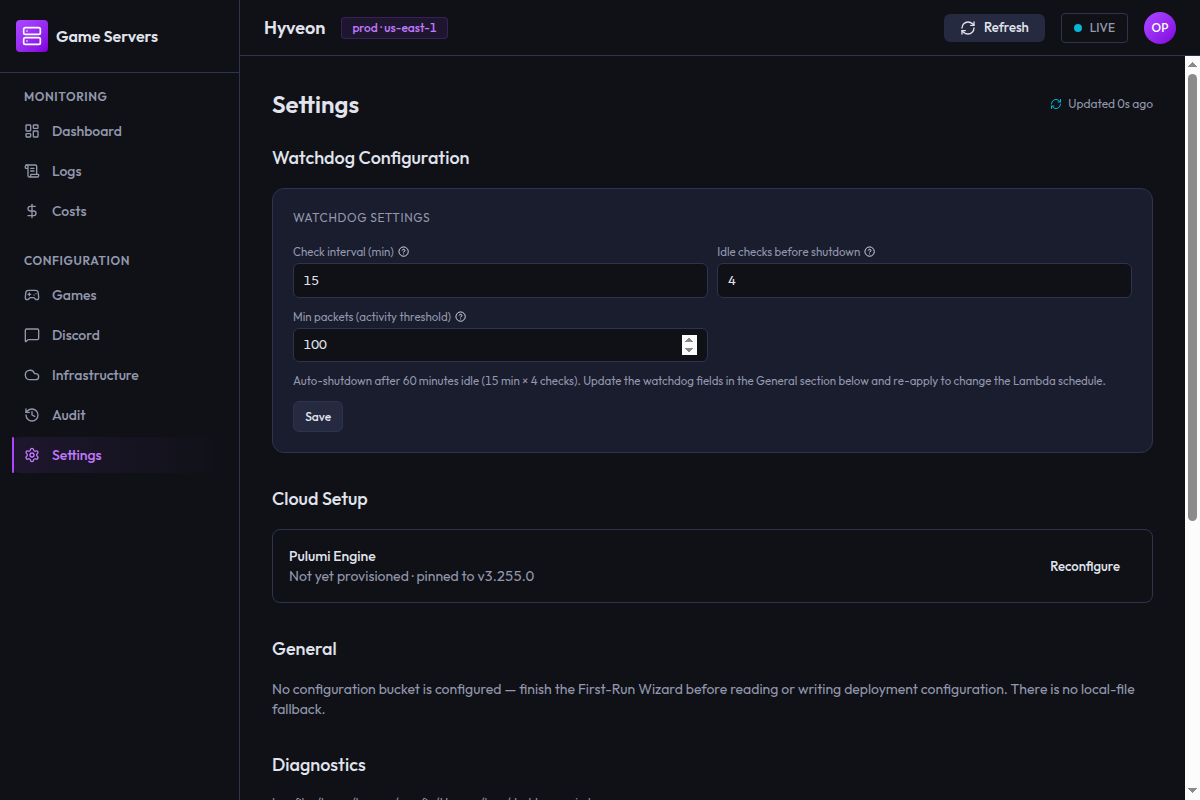
The screenshot above predates the General section described below (it still shows the old placeholder text rather than the deployment-settings form), the read-only Watchdog Configuration panel described next (it still shows the old three-field editor with a Save button), and the Diagnostics panel's Pause/Resume and search controls described below (it shows only the bare scrolling log view).
Six sections, in order: Watchdog Configuration, Cloud Health, Cloud Setup, Updates, General, Diagnostics.
Watchdog Configuration
The watchdog is a Lambda that runs on a schedule, checks how much network traffic each running game server is seeing, and stops tasks that have been idle for long enough. It is what stops you paying for a server everyone forgot to shut down.
This panel is read-only — a pointer, not an editor:
Check interval, idle checks, and the min-packets activity threshold are configured in the General section below ("Watchdog tuning") and take effect on the next apply from the Infrastructure page.
An earlier version of this panel had its own three input fields and a Save
button that wrote to a local server_config.json file the deployed watchdog
Lambda never read — pressing Save showed a success toast while changing
nothing in AWS. That dead flow was removed (#348); the three real tunables are
now read and written in exactly one place — see
General → Watchdog tuning below for what each field means,
its default, and tuning advice.
Cloud Health
An always-visible checklist of AWS-account prerequisites the deployed infrastructure depends on but Pulumi itself won't surface as a plan/apply error — things IAM or another service rejects at runtime instead, with no in-app way to discover why. It runs once on mount and again only when you press Refresh; there is no polling.
It ships with one check:
| Check | What it verifies |
|---|---|
| ECS service-linked role | Whether the AWSServiceRoleForECS service-linked role exists in the account. Its absence makes ECS RunTask fail with InvalidParameterException when a game server starts — with nothing in the UI to explain why. |
Each row shows an icon, the check's label, and a status badge:
| Status | Badge | Meaning |
|---|---|---|
ok | OK (green) | The check passed. No Fix button. |
missing | Missing (red) | The prerequisite isn't in place yet. |
error | Error (red) | The check itself failed to run (e.g. an unexpected AWS SDK error) rather than confirming the prerequisite is absent. |
A row in missing or error status shows a Fix button. Pressing it
tries to remediate inline using the operator's stored AWS credentials — for
the ECS role, that means calling CreateServiceLinkedRoleCommand directly.
One of three things happens:
- Fixed — the whole list refetches, and the row now shows OK.
- Failed — an unexpected error; the row shows the raw error message in place of its usual detail text, and Fix can be pressed again.
- Needs a policy update — the fix call itself came back
AccessDeniedException, meaning the operator'sHyveonDeployAllpolicy predates the permission this check's fix needs. The row shows an amber explanation directing the operator to the IAM console, followed by the currentHyveonDeployAllpolicy JSON in a scrollable code block with a copy button, an Open in AWS Console button (deep-links straight to theHyveonDeployAllmanaged policy's edit page, scoped to the caller's account ID viasts:GetCallerIdentity; falls back to showing the URL as text if a browser can't be launched automatically), and a Download JSON button (writes the policy to disk foraws iam create-policy-versionor similar AWS CLI use). Note this is a direct IAM policy update, not a CloudFormation operation — the JSON is a bare policy document (noResourcessection), so pasting it into CloudFormation's "Create/Update Stack" flow fails with a template-format error. Update the existing policy directly (IAM console → Policies →HyveonDeployAll→ Edit policy → JSON), then press Fix again.
Cloud Setup
A single row showing the app-managed Pulumi engine's version:
Pulumi Engine Pulumi engine v3.255.0 · pinned to v3.255.0
The app provisions and runs against exactly one pinned Pulumi engine version
(PULUMI_ENGINE_VERSION in @hyveon/shared) — unlike the old CLI
prerequisite check this row replaced, there is no "detected vs. minimum"
comparison to make, because there is no host binary to detect: the engine is
downloaded and cached by the app itself (PulumiEngineService), not installed
separately by the operator.
Three possible states for the first line:
| State | When |
|---|---|
Pulumi engine v<version> | The engine has been resolved (downloaded and verified, or reused from cache) at least once this session |
Not yet provisioned | A fresh install that hasn't run the engine yet — first-run setup, the wizard's stack-initialization step, or the first plan/apply will provision it |
Unable to determine engine version | The read itself failed (e.g. the IPC bridge is unavailable) — distinct from Not yet provisioned, which is a real, expected state, not a failure |
The second half of the line (pinned to v<version>) is shown in every state —
it is a plain constant, not something the app needs to look up.
Reconfigure
The Reconfigure button relaunches the setup wizard. It swaps out the whole Settings page immediately, with no confirmation.
Use it to switch AWS profiles, change region, or re-point the deployment at differently-named bootstrap resources. It runs a shortened, pre-filled variant of the first-run flow — the same five steps, with Choose your cloud, AWS credentials, and Bootstrap AWS resources always collapsed to a summary with an Edit button. Provision AWS access collapses too, but only conditionally — it pre-completes only when your currently-active credential is the exact profile guided provisioning produces, and otherwise renders as a live step. Edits to Choose your cloud, AWS credentials, and Bootstrap AWS resources are buffered into a single save when you press Finish setup — Cancel discards them. Provision AWS access is different: completing it writes your active credential source immediately, not on Finish, so Cancel cannot undo it. There is a Cancel button throughout regardless.
See First-run wizard → Reconfigure for the full behaviour, including what Cancel can and cannot undo.
Note that this section only reports the Pulumi engine version. Your AWS profile, region and bootstrap resource names are not shown here — they are inside the wizard.
Updates
The first row, Automatic Updates, has a checkbox:
Check GitHub Releases for updates on app start. Applies on next app start.
The checkbox reads and writes the enableAutoUpdate flag in the app's local
electron-store config (not the deployment configuration in S3 — this setting
is per-install, not per-deployment). It's off by default.
What the flag actually controls: initUpdater() runs once, at Electron
boot (electron-entry.ts). If the flag is off, it logs that update checks
are disabled and returns without touching the network. If it's on, it uses
electron-updater to check GitHub Releases for a newer version and logs the
result ([updater] update available / no update available / a
failed-check error) to the same diagnostics log described below. There is no
download or install here — autoDownload and autoInstallOnAppQuit are both
explicitly pinned false, so an available update is only detected and
logged, never fetched or installed automatically. This is v1 scaffolding for
a future real auto-update flow, not one yet. (See Check Now
below for the on-demand equivalent this toggle does not control.)
Two consequences worth calling out explicitly:
- Flipping the toggle mid-session does nothing.
initUpdater()only runs once at startup, so the new value takes effect on the next app launch, not immediately. - Turning it on does not update the app. It only makes the app check and log whether a newer release exists on GitHub. Until a download/install path ships, updating still means downloading and running the new installer yourself.
Toggling shows one of three states: Checking update setting… while the
initial read is pending, Unable to read the update setting. if that
initial read failed, or the description above once a value is known. The
checkbox only updates after a write resolves — there's no optimistic flip.
A failed write does not drop into the no-value error state or revert the
checkbox — it keeps showing the last confirmed value and displays Failed to save — still showing the last saved value. inline instead.
Check Now
A second row, Check Now, sits directly below the toggle with its own
Check for Updates button. It runs a one-off electron-updater check via
checkForUpdatesNow(), completely independent of the Automatic Updates
toggle above — the toggle only gates initUpdater()'s automatic check at
boot; pressing this button works the same whether the toggle is on or off.
Same restriction as the automatic check: it never downloads or installs
anything (autoDownload and autoInstallOnAppQuit stay pinned false) — it
only reports what it found, inline in place of the row's description text:
| State | Copy |
|---|---|
| Check in flight | Checking for updates… |
| Up to date | You're up to date. |
| Newer version found | Update available: v<version> |
| Check failed | The raw error message (e.g. offline, a malformed feed) |
Outside a real Electron main process — no process.versions.electron, e.g.
the plain-Node integration test harness — the button still works but always
reports Update checks are only available in the packaged app. rather than
attempting a network call. This is not the same check as "packaged vs.
npm run desktop:dev": a dev-mode Electron session still has
process.versions.electron set, so it does attempt a real check. The button
disables itself only while a check is in flight.
General
Reads and writes every top-level field of the deployment configuration
(deployment-config.json in the operator's configuration S3 bucket) EXCEPT
gameServers — games have their own dedicated Add-game wizard and edit form
on the Games page. This is the only place to change these
values without hand-editing the JSON object in S3.
| Field | What it is |
|---|---|
| Project name | Prefix used to derive default resource names, e.g. ${projectName}-audit |
| AWS region | Region the stack deploys into |
| VPC CIDR | CIDR block for the VPC, e.g. 10.0.0.0/16 |
| Hosted zone name | The Route 53 hosted zone domain (must already exist). Required — there is no default |
| DNS TTL (seconds) | TTL on the per-game DNS A records the watchdog Lambda writes |
| Discord application ID | The bot's public Application (Client) ID — can also be set from the Discord page's Credentials tab |
| Watchdog tuning (3 fields) | dnsTtl's siblings — check interval, idle checks, min packets — see below |
| Base allowed guild IDs / admin user IDs / admin role IDs | See below |
| Audit table name / Runs table name | See below |
Watchdog tuning
The three fields that actually reach the deployed watchdog Lambda — the Watchdog Configuration panel at the top of the page only points here, it has no editable fields of its own (see that section above).
| Field | Unit | Default | What it means |
|---|---|---|---|
| Check interval (min) | minutes | 15 | How often the watchdog inspects each running task. Lower means faster shutdown but more Lambda invocations |
| Idle checks before shutdown | count | 4 | How many consecutive idle checks must pass before the task is stopped |
| Min packets (activity threshold) | packets | 100 | A task receiving fewer than this many network packets during an interval counts as idle |
Saving here writes into the deployment configuration itself — the same values
Pulumi bakes into the watchdog Lambda's EventBridge schedule
(rate(<interval> minutes)) and environment variables at apply time (see the
infra program reference). It only takes effect after the
next apply from the Infrastructure page, same as any other field
in this section.
Tuning advice:
- Min packets is the one to adjust first if servers are being stopped while people are still connected. Some games send keepalive traffic even when idle; if the baseline chatter exceeds 100 packets per interval the server will never look idle, and if a connected-but-quiet player generates fewer, they will be cut off.
- Interval × idle checks is your grace period — with the defaults, a server with no players stops an hour after the last packet. Shortening the interval makes shutdown more responsive but also makes a brief network lull more likely to trip the counter — which is why the counter requires consecutive idle checks rather than a single one.
The idle counter is stored as a tag on the ECS task itself, so it resets naturally whenever a task starts.
Discord admin allowlists
Base allowed guild IDs, base admin user IDs, and base admin role
IDs are a permanent floor written to the BASE#discord DynamoDB row on
every deploy — distinct from the dynamic allowlist/admin list managed from
the Discord page, which the operator can freely add to or
remove from at runtime. What's set here can only be changed by editing it
here and re-applying; the app can only add to or remove from what it itself
added dynamically. Add an ID by typing or pasting it and pressing Enter or
,; remove one with the × on its chip, or Backspace on an empty
input to remove the last one. Each entry must look like a Discord snowflake
(17-20 digit numeric string).
Audit table name / Runs table name
Both default to blank, which the infrastructure program resolves to
${projectName}-audit / ${projectName}-runs at apply time — the field
shows that computed name as placeholder text (e.g. auto (hyveon-audit)).
Leaving either field blank is valid; only set a value to override the
computed default.
Validation and saving
Client-side validation runs on every keystroke and mirrors what the backend enforces — the same rule can never be phrased differently in the two places. Save settings stays disabled while any field is invalid:
| Field(s) | Rule |
|---|---|
| Hosted zone name, project name, AWS region | Must not be blank |
| VPC CIDR | Must look like an IPv4 CIDR block, e.g. 10.0.0.0/16 |
| DNS TTL, the three watchdog fields | Must be a positive whole number |
| The three Discord ID lists | Each entry must be a 17-20 digit Discord snowflake |
| Audit table name, runs table name | Never flagged — blank is a legitimate "use the computed default" value |
The form loads the current settings (and a version tag) on mount, and always sends that version tag back on save — if someone else changed the configuration since this page loaded, Save settings is rejected rather than silently overwriting their change, and the page shows "This setting was changed elsewhere since you loaded this page — reload and try again." with a Reload button. A server-side validation rejection re-renders the same fields with the reported issues rather than a generic failure banner.
Diagnostics
The last 500 lines of the desktop app's own log — the main process's structured log, not your game servers' CloudWatch logs and not Pulumi run output. This is where to look when the app itself misbehaves: a failed IPC call, an AWS SDK error the UI swallowed, a Discord command registration Discord rejected.
Above the log box:
Log file:
/home/you/.config/Hyveon/logs/main-2026-07-26.log
The exact directory is platform-specific (your user-data directory), but the
filename always follows the pattern main-YYYY-MM-DD.log using today's
local date. Logs rotate daily, and this panel only ever shows today's
file — there is no date picker. To read an earlier day, open the file from
that directory yourself.
The panel polls for new lines every five seconds regardless of anything below — pause and search only change what's rendered from that poll, never whether it happens. There is still no copy or open-folder button for the path itself; it remains selectable text.
Because this is the same log file the renderer's own console output is
forwarded into (see Management app),
lines written by console.log/info/warn/error calls in the app's own
UI code — prefixed renderer console (...) — and by uncaught renderer
crashes — prefixed renderer error (...) — show up here too, alongside the
backend's own logger.* output.
Pause and Resume
The button toggles between Pause and Resume. Pausing does not stop
the five-second poll — the app's own log is fetched as a full snapshot each
time (not an incremental delta the way /logs's CloudWatch stream is), so
there's no partial update to append while paused. Instead, each poll while
paused is held back internally, and pressing Resume replaces the view
with that latest snapshot in one step — never by appending poll responses
one after another, which would duplicate or reorder lines given the
snapshot (not delta) shape of the data. The status line at the bottom of
the panel shows · paused while paused.
Autoscroll-to-bottom (unconditional, same as before — there is no separate
on/off setting) is suppressed while paused, for the same reason /logs
suppresses its own autoscroll during a pause — so the view doesn't get
pulled out from under you while reading.
ANSI colour rendering
The Diagnostics panel shares the same line-rendering component as /logs,
so ANSI colour escape codes in a line render as coloured text here too,
rather than as raw escape characters.
Search highlights, it does not filter
The search box (Search visible lines…) highlights matching substrings in
place, wrapped in <mark> — it does not remove non-matching lines or change
the line count.
The status line at the bottom reports the line count and whether the view is
paused, e.g. 214 lines · paused.
| State | Copy |
|---|---|
| Loading | Loading diagnostics… |
| No log file yet, or it is empty | No log lines available. |
| Read failed | The raw error message, in a red banner replacing the whole panel |
A brand-new install shows the empty state rather than an error, because the log file does not exist until the first write.
Export diagnostics bundle
The Export diagnostics bundle button produces a single .zip file
containing enough information to hand to support (the project maintainers)
without you having to copy-paste anything yourself.
Clicking it opens a native save dialog — you choose where the file goes, on your own disk. Nothing is uploaded anywhere; this app has no Hyveon-owned backend to upload to, by design. Cancelling the dialog does nothing further: no file is written, and no error is shown.
The bundle contains four sections, gathered independently so a failure in one never blocks the others:
- Logs — the same recent log content the live tail above reads, passed through a secret-scrubbing pass before being written into the archive.
- Config summary — an explicit allowlist of non-secret deployment settings (project name, region, watchdog tuning, table names, and a resource-sizing/feature-flag summary per declared game). Credential-shaped fields are never included, and a field added to the configuration after this feature shipped is excluded by default until it is deliberately added to the allowlist.
- Metadata — app version, Electron and Node runtime versions, OS platform and version, and the current Automatic Updates setting.
- AWS snapshot — a best-effort read of the same resource-status information already surfaced elsewhere in the app (deployed stack identity and per-game ECS status). This section may be missing or incomplete if AWS credentials aren't configured or a call fails — that's expected, not a bug.
Any section that fails to gather is recorded — by section name and a
short, human-readable message only, never a raw error or stack trace — in
an errors.json file inside the bundle, and the export still completes
with whatever other sections succeeded. Even a bundle where every section
failed is still a valid export: it contains errors.json describing all
four failures.
On success, the panel shows the path the bundle was written to and a Show
in folder action that reveals it in your OS's file manager. If writing the
completed archive to disk fails (disk full, permission denied), the panel
shows an error message instead — no partial, half-written .zip is left
behind at that path.