Logs
The Logs screen (route /logs) tails one game server's CloudWatch logs live.
It is the first place to look when a server will not start, or when players
report something odd.
CloudWatch tail for the selected game. Pause to inspect; resume to flush the buffer.
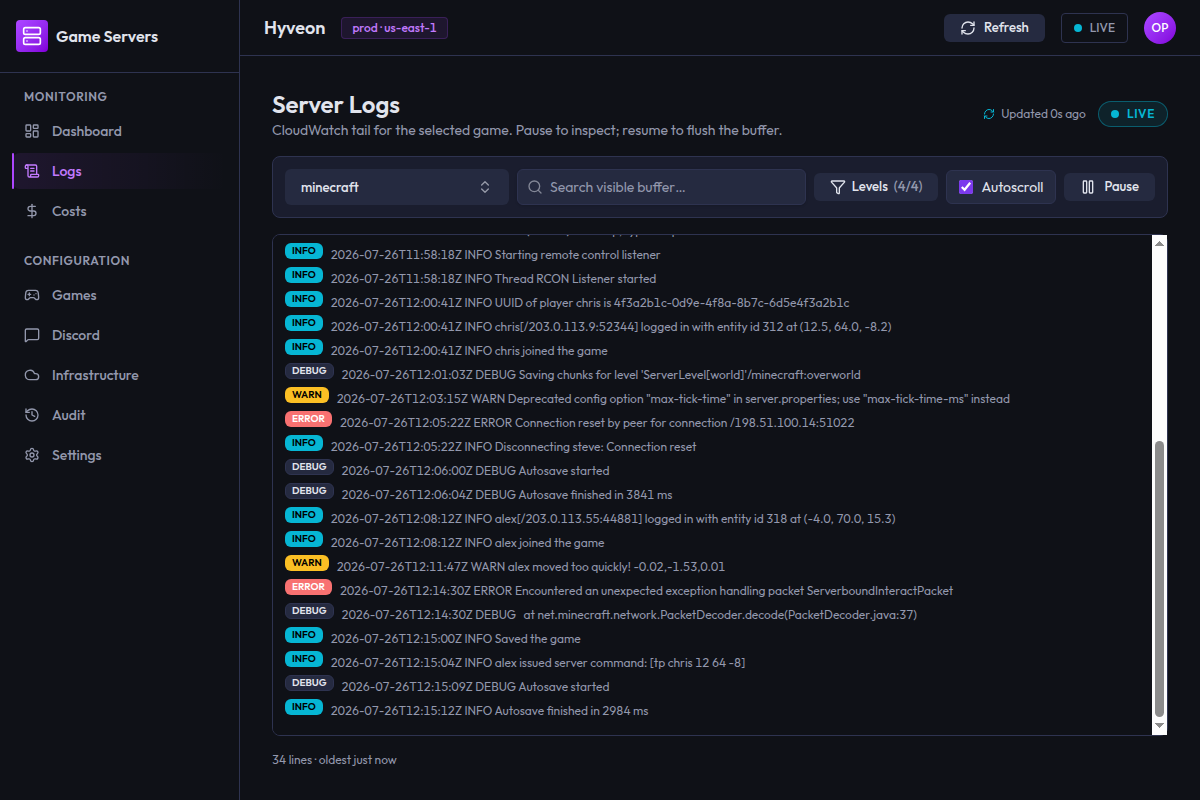
In the sidebar, Logs (under Monitoring) is a group with two always-visible children: Game Logs, this page, and Infra Logs, which tails the app's Lambda functions instead — see Infrastructure logs below.
Where the logs come from
Logs are read from CloudWatch Logs, from the log group /ecs/{game}-server
— the group the Pulumi infra program creates for each entry in gameServers
(defineEcs in @hyveon/infra).
Opening the page does two things: it fetches a snapshot of the most recent lines from the newest log stream, then it opens a live tail that polls CloudWatch every two seconds for anything new.
The live tail starts from the moment you subscribe, so it only shows lines produced from then on. Everything before that comes from the snapshot.
If infrastructure has not been deployed, the live tail fails immediately and
the error banner reads Stream ended with error: Infrastructure is not deployed. Run Apply on the IaC page first. If the game has never run (the log
group exists but has no streams yet), the snapshot comes back as a single
line reading No log streams found for minecraft. — rendered as an ordinary
log line, not as an error.
Choosing a game
The combobox at the top left shows the selected game, or Select a game….
Opening it focuses a search field (Search games…) so you can type straight
away; matching is a case-insensitive substring on the game name. If nothing
matches you get No games found.
Pick an option with the mouse, or Tab to it and press Enter. Press Escape or
click outside to close without changing anything.
Selecting a game restarts the stream. Specifically, switching games:
- clears the visible buffer,
- discards anything buffered while paused,
- resets Pause back to Live,
- clears any error,
- re-fetches the snapshot and reopens the tail.
Your search text and autoscroll setting are not reset.
Arriving here via a game card's Logs button pre-selects that game. If you open the page directly, the first game in the list is selected for you.
ANSI colour rendering
ANSI colour escape codes in a line (the 16 standard terminal foreground colours plus bold) are rendered as coloured text rather than shown as raw escape characters, so output from a colourised source process still reads as intended.
Search highlights, it does not filter
The search box (Search visible buffer…) highlights matches in place. It
does not remove non-matching lines, and it does not change how many lines are
shown.
Matching is case-insensitive, and every occurrence in a line is highlighted, not just the first. Clearing the box removes the highlighting.
This is deliberate: when you are reading a stack trace, filtering a log to matching lines destroys the context you needed the search for.
Autoscroll
The Autoscroll checkbox is on by default: every new line jumps the view to the bottom. Unchecking it freezes the scroll position so you can read something while the stream continues.
Autoscroll is also suppressed while the stream is paused.
Pause and Resume
The button on the right toggles between Pause and Resume, and the pill
in the page header switches between LIVE and PAUSED.
Pausing does not stop the stream. New lines keep arriving; they are held in a buffer instead of being appended to the view. While paused, the footer shows how many are waiting:
buffered 37
Pressing Resume flushes that buffer into the view in one go and returns to live tailing. Switching games while paused discards the buffer and returns to Live.
If you pause while already scrolled up into historical mode, resuming does not splice the buffered live lines into the middle of the historical window you are looking at — they stay held until you explicitly click Jump to latest (see The 300-line window, and scrolling up for history). Pause/Resume and historical mode buffer independently but never fight over the same buffer.
The 300-line window, and scrolling up for history
The viewport holds at most 300 lines at a time (WINDOW_SIZE in
useLogTail). In normal tailing this works the same as before: once the
window is full, the oldest visible line is dropped as a new one arrives.
What changed is that this is no longer a hard ceiling on how far back you can
see. Scroll near the top of the log box and the viewer switches into
historical mode and fetches an older page of CloudWatch log events
automatically, prepending it above what is already loaded. Keep scrolling up
and it keeps paging back through history, one WINDOW_SIZE page at a time —
including across however many separate CloudWatch log streams a restarted
game server or Lambda instance produced, so a restart never hides older lines
behind a "beginning of retention" marker that isn't real.
While a backward fetch is in flight, a small Loading older logs… line shows
at the top of the box. When a backward fetch comes back empty — you have
reached the real start of what CloudWatch has retained for that log group —
the viewer shows — Beginning of log retention — at the top and stops
issuing further backward fetches for the current target.
While you are in historical mode, the live tail does not stop — new lines keep arriving, but they are held in a buffer instead of being spliced into the historical window you are reading, exactly like the pause buffer described above. A Jump to latest button appears, floating at the bottom of the log box, for as long as you are in historical mode.
Scrolling back down toward the bottom of a loaded historical window pages
forward the same way scrolling up pages backward — one WINDOW_SIZE page at
a time, not one big jump — so continuing to scroll down eventually catches
you back up to the present without losing anything in between. This does not
by itself return you to live-tail mode.
Clicking Jump to latest is the only way to leave historical mode. Pressing Resume while paused does not — see Pause and Resume above. Jump to latest discards everything currently loaded or buffered — the historical window and any live lines held back while you were reading it — and loads a fresh recent snapshot, exactly as if you had just opened the page, then returns to live tailing with autoscroll re-enabled. Buffered live lines are not spliced into the view; they are simply discarded in favor of that fresh snapshot.
This is a view window, not a log retention setting — nothing is deleted from CloudWatch either way, and how far back you can page is bounded by CloudWatch's own retention for that log group, not by anything the app enforces.
The pause buffer itself is not capped, so a long pause can accumulate more
than 300 lines; the cap is applied when you press Resume, keeping the newest
300. Note that the footer's buffered N count (see Pause and
Resume) only appears while paused — lines buffered purely
because you are in historical mode (not paused) are not surfaced there; the
presence of the Jump to latest button is the signal that live lines are
being held back.
On a narrow window
Below a certain width the search box and the Autoscroll checkbox collapse behind a Filters button. Expanding it reveals the same controls stacked vertically.
The game combobox and the Pause/Resume button stay visible at every width.
Empty and error states
Inside the log box:
| Situation | Copy |
|---|---|
| No game selected | Select a game to start tailing. |
| Game selected, nothing to show | Waiting for log lines… |
Errors appear in a red banner above the log box:
| Copy | Meaning |
|---|---|
Could not load games. | The games list failed to load, so there is nothing to select |
Could not load initial logs; trying live stream. | The snapshot failed; the live tail is still being attempted |
Stream ended with error: … | The live tail died |
Could not load older logs: … | A scroll-up backfill fetch (getOlder) failed |
Could not load newer logs: … | A scroll-down forward-paging fetch (getNewer) failed |
Could not load latest logs: … | Jump to latest's fresh snapshot fetch (get) failed |
IPC bridge (window.hyveon) is not available in this context. | The renderer lost its connection to the app's backend |
Transient CloudWatch hiccups during the tail are surfaced inline as a log
line rather than in the banner, prefixed [stream error].
Infrastructure logs
The Infra Logs page (route /logs/infrastructure) is this page's sibling: it tails one of the app's 5 Lambda functions instead of a game server.
Both pages are thin wrappers around the same useLogTail hook, so tail/pause, ANSI colour rendering, search highlighting, autoscroll, and the 300-line window with scroll-up history backfill all behave exactly as described above in ANSI colour rendering, Search highlights, it does not filter, Autoscroll, Pause and Resume and The 300-line window, and scrolling up for history — nothing about that behaviour differs between the two pages.
What's different is where the logs come from and how you pick a target:
- Instead of a game combobox, a row of 5 buttons picks the function:
watchdog,health-check,dns-updater,interactions,followup.watchdogis selected by default. Like the game combobox on this page, this picker stays visible at every width — it is not one of the controls that collapses behind the narrow-window Filters button. - Each function's logs come from the CloudWatch log group
/aws/lambda/{projectName}-{functionKey}, whereprojectNameis the operator's configured project name (falling back tohyveonif it can't be read). For the default project name, that means log groups like/aws/lambda/hyveon-watchdog. - As on this page, opening it fetches a snapshot of the most recent lines and then opens a live tail; the Lambda tail polls every two seconds, same as the game-logs tail.
health-checkis conditionally provisioned: its CloudWatch log group only exists once at least one game in the deployment declares ahealthCheck. Picking it before that's configured shows an informational "no log group yet" message instead of an error, and the live tail stops after that single message rather than polling forever.
What this page is not
- It does not show the Hyveon app's own logs. Those are on Settings → Diagnostics.
- It does not show Infrastructure (Pulumi) output. That lives on the Infrastructure page and in run history.
- It does not show Lambda logs. Those are on the sibling Infra Logs page — see Infrastructure logs above.